

Today’s post talks about some of the Best Metering Hardware around. For the longest time, sound engineers have relied on their ears to accurately master their sound by adjusting levels, eliminating signal clipping, establishing a correlation between channels and much more.
However, wouldn’t it be better if there was a device that could quantify what you hear and validate the decisions made by ear? Well, the devices on today’s list do exactly that. While you may think of the very basic and functionally limited VU meter when you hear the word “Audio Metering”, today’s metering hardware has improved by leaps and bounds and has much more to offer.
You’ll now find highly responsive metering devices that use detailed charts and bars to elaborately show the behavior of your sound signal and channels/tracks. The displays are color-coded, with each color covering a different aspect of the story. You’ll also find a multitude of input/output options on the back to give you the freedom to set the signal source as per preference.
This post will not only give you an idea of the features of today’s metering hardware but will also explain how essential they are to your mixing setup. Possessing descriptive displays and enhanced algorithms, the Clarity M Stereo and TM-3 Primus will surely impress you with several features hidden in their compact packaging.
Best Metering Hardware Available (Spectrum Analyzer, Stereo, Loudness..)
1. TC Electronic Clarity M Stereo
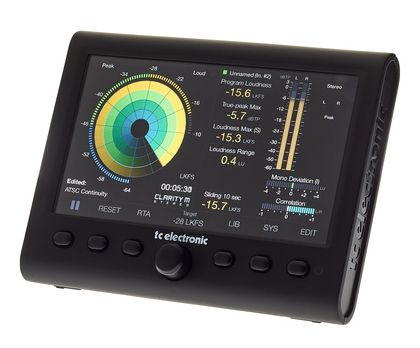


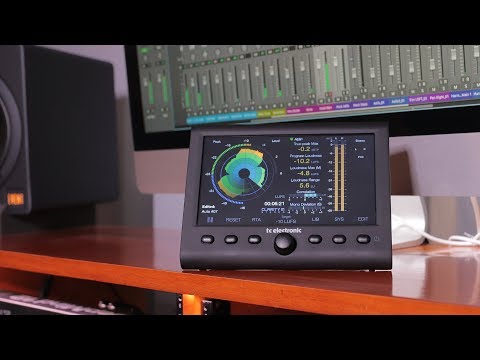
TC Electronic’s Clarity M Stereo is a handy tool for finalizing a mix.
The device is a metering tool that helps to make important mixing decisions by showing statistics and graphical representations of different mixing aspects. If there was ever a tool to instantly quantify your mix’s loudness, channel correlation and balance, this is it. The brilliant display shows all the necessary parameters you need to make the correct mixing decisions.
The screen is divided into different sections, which makes the device easy to comprehend. The left side of the screen is image-based and shows three different modes: Radar, RTA and Vector Scope. The right side is more stats based and shows different variables and descriptors. This section can be easily customized from the edit mode.
Key Features:
- Appearance
The Clarity M comes with a 7-inch colored display. The high-resolution screen has an easy-to-navigate layout with different sections to show key features and parameters.
The screen also shows a horizontal strip of modes which can be accessed using the corresponding button from a row of 6 button controls available on the interface. In addition, an adjustment knob placed in the center of the button strip can be used to adjust different parameters.
- Radar Mode
The purpose of the radar mode is to give an insight into short-term loudness. The radar moves clockwise and slowly fades to refresh itself as the round is completed. Several multicolored rings can be seen where the outer ring shows momentary loudness.
The radar’s core is colored black, and the rings are colored blue, dark green, light green and yellow. While in radar mode, pressing the first button will pause the measurement. The second button can be used to reset all values, while the third button can be used to switch to RTA mode.
The adjustment knob can control the radar’s speed by default, but its functionality can be changed through the system menu. The top left region shows a “peak” indicator which lights up during peaks. Similarly, the top right has a loudness indicator that shows when the loudness level is hit. The ranges and levels of the radar can be set from the edit menu.
- RTA Mode
The Real-Time Analyzer shows an overview of the mix while the audio is being played. Here you can look at the different frequencies and levels to decide which of them to cut back on through the band zoom feature.
When in RTA mode, pressing the first button allows you to set the top values of the level scale. The second button behaves the same way as in Radar Mode and resets all the values. The adjustment knob can be used to select different frequencies to look at a more detailed view.
- Vector Scope
The job of the Vector Scope is to show a graphical representation of the relationship between the left and right channels. The identical or mono channels will appear as a straight line, while purely stereo sound will show a wider graphic that shows separation between the channels.
Here the adjustment knob can be used to set the input scaling value from a range between 0 and -24 dB. The Vector Scope has fast and slow scaling options as well.
- Loudness Descriptors
This section is of great significance as it shows the details of your mix in relation to international loudness standards. The parameters here include Program Loudness, True-peak Max, Loudness Max, Loudness Range, and Peak to Loudness. The section is customizable, and the user can also show or hide different parameters and change their order.
- Balance-O-Meter
The purpose of the Balance-O-Meter is to show the directional balance of your mix. Here you will see an encircled triangle flanked by the “L” and “R” symbols and “mid/side” labelling on the top and bottom of the graphic.
When the triangle’s top is centered, it means that the left and right balance is perfect. The width can be assessed by the broadness of the triangle’s base. If the mix is inclined more towards a certain channel, the triangle’s peak will tilt in that direction, and the triangle’s base will become narrower to show the imbalance.
A balanced mono signal will appear as a vertical line. The Balance-O-Meter can be disabled or enabled through the edit menu and will take up two slots in the descriptor section.
- Source Section
As the name suggests, this section simply shows the source of the signal. Here you’ll see the source’s name with a colored box to show the current status. For example, green means the source is connected and active, while red means no connection. Digital inputs and plug-in information will be shown here depending on where the signal is coming from.
- True-Peak Meter
The True-Peak Meter uses TC Electronic’s renowned and highly accurate True-Peak algorithm. The graphic is used to get an idea of any clipping issues that may arise due to high frequencies in the mix so that appropriate measures can be taken to avoid unwanted distortion.
The True-Peak Meter can also be resized to make use of the whole section for improved legibility. You can also select from several different layouts as per preference.
- Channel Measures
The Channel Measures section shows two horizontal ranges that light up to show changes. The upper strip is labeled “Correlation” and compares the left and right channels. The “Mono Deviation” strip shows how the signal behaves when down mixed. Down mixed is when the nature of the signal is changed from stereo to mono.
Pros:
All the information you need is organized and displayed in a single, customizable unit with its own display and hardly takes any space on your workstation. The Radar mode is handy, and the Real Time Analyzer will allow you to monitor changes as you make them. The descriptor section holds valuable numerical data and helps to control unneeded distortion.
Cons:
Certain software solutions/plug-ins will do the same work as the Clarity M Stereo, so it is up to you to decide if you want to spend a few hundred dollars to improve your workflow. In addition, it would’ve been a good feature if the device had a touch screen display to enhance usability even more.
Choose If:
Suppose you want all your levels, loudness, peaks, and balance parameters on a single unit with helpful graphical representations and a decent-sized display. In that case, the TC Electronic Clarity M Stereo is an ideal choice for you. It will save you time and streamline your workflow considerably.
2. RTW TM3-Primus
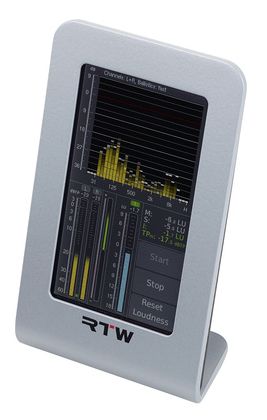


RTW is a German company that deals in state-of-the-art audio monitoring equipment.
The company has been around for more than 50 years and strives to provide innovative solutions to the monitoring needs of professional and home-based studio setups. With their TM3-Primus, RTW aims to provide an abundance of features in a small but quality product that promises to increase efficiency and enhance your workflow.
RTW’s TM3 series comes in a couple of variants that are feature rich and extremely compact at the same time. The TM3-Pri-2U is a panel mount device, whereas the TM3 is a more desktop-friendly unit. The company also offers an interface box that can be used in conjunction with the TM3 series to add to its input and output capabilities.
Key Features:
- Display & Ports
The RTW TM-Primus has a vivid 4.3” display with great clarity and sharpness. The display is touch-enabled and responsive so that you can navigate it relatively easily. The unit has a stand at the rear and can be used vertically and horizontally. The screen will adjust automatically to the orientation of the device.
The TM3- Primus has a couple of analog RCA inputs and a S/PDIF input and output port. The USB port on the back is used for computer connectivity and to power the unit. The unit also includes two adjustment screws for the sensitivity of the left and right RCA input ports.
- Vectorscope
The Vectorscope is placed on the upper half of the screen and is designed to depict the relationship between the left and right channels in terms of phase. This relationship is measured in real-time on a plane that is rotated by 45 degrees.
The image may show a straight line if the signal is mono or different variations in width, filter effects and phase shifts depending on the nature of the stereo channels compared to each other.
- Chart Feature
This color-coded chart shows the loudness on the y-axis and time on the x-axis. At a glance, you can see the level of the gate and the tolerance range, which can be adjusted. The waves beyond the tolerance range will enter the realms of loudness and are highlighted in red.
Further customization related to the chart can be done through the setup menu. Once the parameters are selected, the chart will appear in the upper half of the display.
- RTA
Much like the M Stereo, the TM3-Primus has a Real-Time Analyzer which measures the audio signal’s strength among different frequency bands. The basic layout of the RTA on the TM3-Primus is like a bar graph that uses 1/3 octave steps to display different parameters with the help of 31 filter bands.
Depending on the spectrum created by the peaks of each bar, you can analyze the signal’s shape and determine which frequencies to enhance or cut back.
- TP/PPM Bar Graph
This section shows a vertical bar graph for a specific channel. You can instantly get an idea of the levels of both left and right channels and the available headroom in each case. A spot correlator at the bottom changes color to show the correlation between the channels.
Here green means “ok”, white means that there’s no relation and red means that a faulty phrase relation exists. The setup menu opens more options related to the mode.
- MC Moving Coil & Correlator
This mode allows you to select a variety of needled meters to measure various parameters. The options include PPM, PPP + Loudness and VU meters. The left and right channels can also be displayed by using 2 individual meters.
The correlator strip shows the phase relationship between channels. For example, identical channels will show a correlation of +1, no correlation will be shown as 0, and negative phase relationships will be shown as -1.
- Loudness Bar & sMagic LRA
The Loudness Bar shows the total loudness of all the combined signals. The tolerance range is marked green; if the signal’s loudness goes beyond it, you will get unwanted distortion. Similar to the Loudness Bar, the Magic LRA shows the summed-up loudness range of all channels in different shades of green. The lighter the shade, the more loudness there is.
- Numeric Instrument, Monitoring, Keyboard
The Numeric Instrument is a handy feature that lets you see important values in one go. The parameters here show momentary loudness of individual channels based on a window of 400ms, short-term loudness showing the total loudness in a 3-second window and integrated loudness to see the total loudness in a user-defined time.
Other parameters include the loudness range and measures of the highest peaks. The monitoring mode gives access to a fader that can control the volume of the displayed signals, whereas the keyboard feature allows you to change mode-specific characteristics.

Pros:
The RTW TM3-Primus comes in an incredibly sleek design and hardly takes up too much of your workspace. The colored display is versatile as it has touch capabilities and reduces the number of steps to perform a certain function. In addition, the number of modes on offer allows you to monitor several parameters in real time easily.
Cons:
Much like the case with the previous device, most of the offered monitoring features can also be managed through software and plugins. While the display has a sharp picture quality, the screen size is quite small, and for someone who prefers bigger images and more legible parameters, this might not be the instrument for you.
Choose If:
The TM3-Primus is built purely for monitoring purposes and gives you a high level of control regarding different characteristics related to your mix. The touch screen display makes navigation easy, but one thing to consider here is that though the device is quite compact, the 4.3” display is on the smaller side too. So, if that doesn’t bother you and you’re willing to look past the bigger price tag, try the TM3.
Bonus: Metering Plugin to use with Tablet
Process Audio Decibel (Metering Toolkit)
More Info & Price (Trial Available)


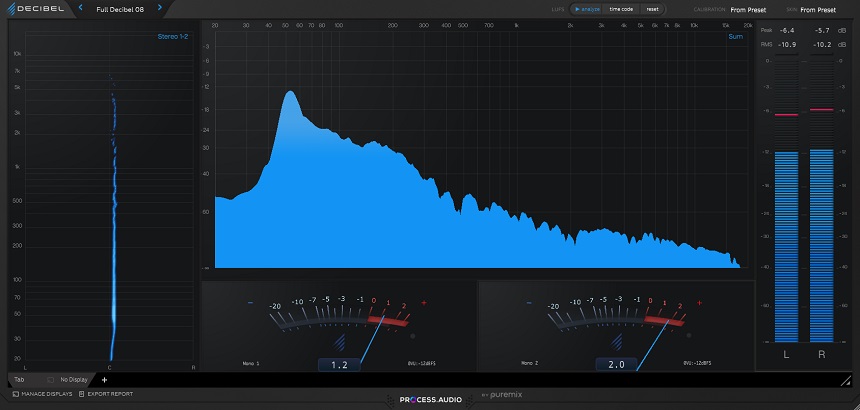
The flexible tool Process Audio Decibel, which also functions on your phone or tablet, provides you with a very effective metering system.
Decibel is a versatile measuring platform used as a plugin or independent program. Additionally, it has a unique audio driver that enables you to pass any program’s audio to the standalone application, guaranteeing almost complete compatibility with all production tools. Markings on the semicircle indicate goal and peak levels, while quantitative monitoring systems in the screen’s center give integrated current, TrueDyn, and real max levels.
Decibel would be considered a very good metering system if it were the only thing it could handle. But Decibel has something much wiser up its sleeve: the meter panels you design with Decibel can be transferred to a mobile device for display, whether a phone or tablet running iOS or Android. This frees up your computer’s screen so you can focus on recording and editing.
Key Features:
- Multiple Meters
The plugin offers a variety of views and may hold numerous counters in a single instance. Most of them are aesthetically pleasing but typical examples of their kind, such as authentic frequency analyzers, VU meters, and max level meters in the bar and point styles.
The reading from the Numeric Box, which you may use to display a numerical reading from numerous measurement sources, is less prevalent.
- Super Meter
The Super Meter is, without a doubt, the most remarkable and inventive of Decibel’s indicators. A single, bold, semi-circular readout visualizes several LUFS volume readings. The semicircle’s bands display the combined and quick LUFS readings.
The accompanying “TrueDyn” value, a dynamic range measurement generated from LUFS readings, is highlighted by additional indicators.
- User Interface
Decibel alone determines which meters show and how they appear. However, even after closing and restarting the plugin and the app, You will have no trouble initiating the connection between Decibel and Decibel Display. Layout creation can be a little challenging, but it’s not hard, and once you’ve achieved the desired appearance, you can store it as a preset.

Compatibility:
This plugin is available for macOS 10.10 or higher (64-bit only) and Windows 7 or higher (64-bit only) and als is running iOS or Android. It runs in standalone mode and VST2, AAX, and AU plugin formats.
Summary:
Decibel is unquestionably a great measuring platform, however, there is potential for enhancement in the form of more measurement possibilities. The Super Meter is great, the aesthetics are clever and lovely, and being able to view your meters on a portable device easily is a game-changer. Process Audio has produced a work of art.
Other than that, there are similar software like T-Racks 5 Metering, or iZotope Insight 2.
Conclusion
With the advancement in technology, these metering devices offer great promise in terms of what they can do. Gone are the days when everything was done by ear. The metering hardware discussed here not only compliments the human ear but can also pick up other subtleties that we cannot without using modern technology.
Be sure to check out both devices at your local music store to see them in action and get a hands-on experience of their different menus and capabilities. Regardless of the level and size of your setup, the addition of such hardware will surely enhance your mixing experience and streamline your workflow.

Sultan Zafar is a guitar player from Islamabad, Pakistan. He has been playing music with various mainstream musicians for over 20 years. He is a song writer and music producer. These days he spends his time exploring different music genres and collaborating with fellow musicians on various projects. Read more..